UPDATED MAP
Remember this? This is the OLD plant hardiness map that farmers and gardeners have been using for more than 100 years.
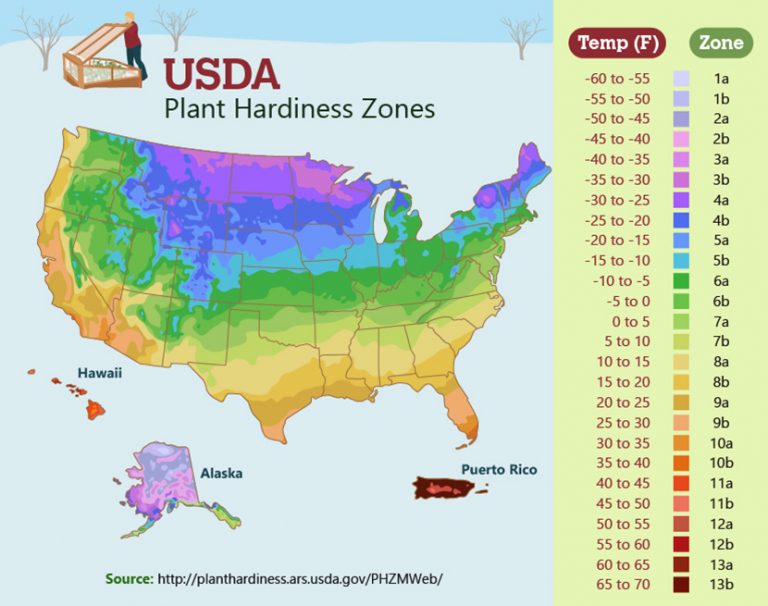
On November 15th, the USDA released their updated plant hardiness map. Click the link to check it out:
In 2012 the USDA used 7983 weather stations to collect data for the previous map. For the 2023 map they used 13,412 weather stations, making it more precise. Because of this and the use of more sophisticated mapping methods, map developers on the project cautioned against attributing updates made to some zones as indicators of global climate change.
While planning your next garden, you will want to check out the new map as there have been significant changes. This is the perfect time to begin getting acquainted with the new map and all the features that are available on the website.
The new map is interactive and provides data down to 1/4-mile. For someone like me, whose property showed as 7b-ish on the old map but, (depending on the resolution), might be closer to 7a, being able to get down to MY STREET was very helpful.
Now, I am smack dab in the middle of zone 8a!
I found a You Tube video from Bootstrap Farmer who does an excellent job of explaining the new map. I found it very informative. Check it out HERE.

You must be logged in to post a comment.